Spectroscopy

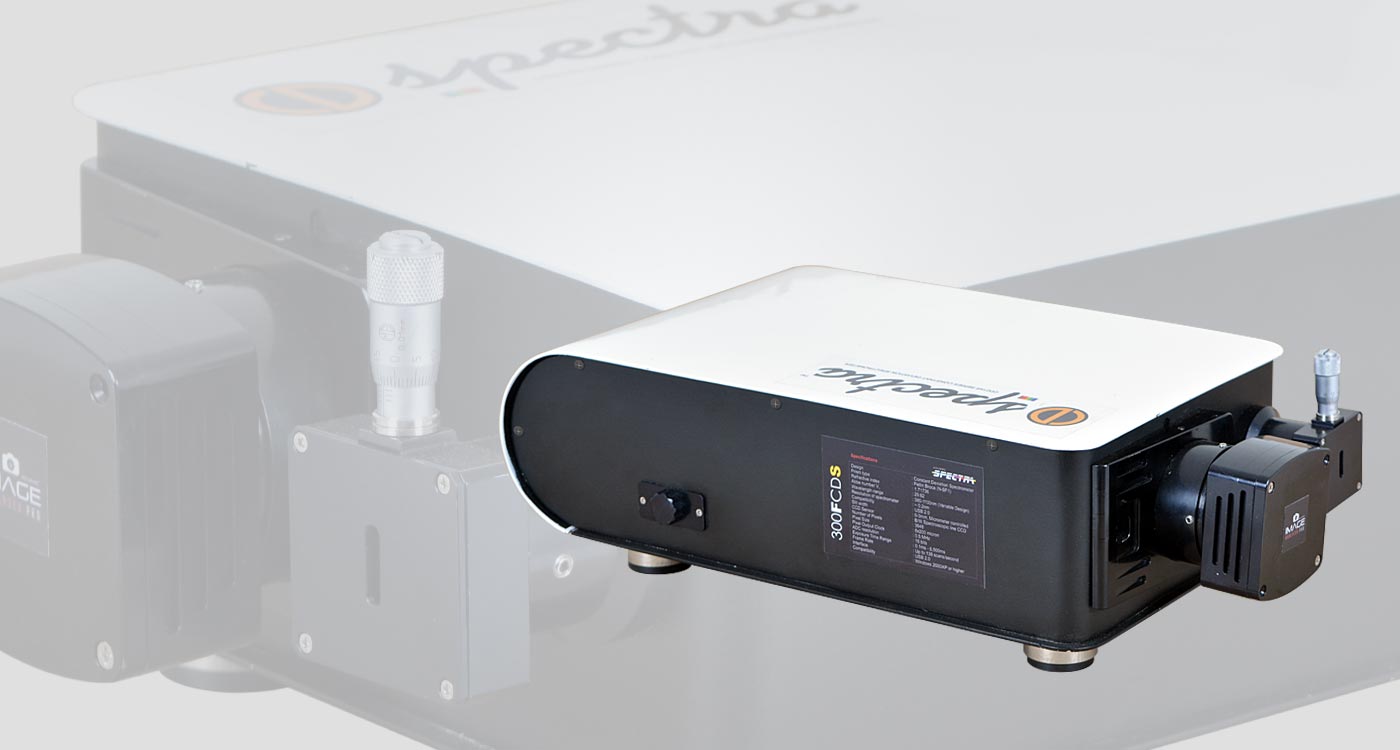
Spectra CD214 is a CCD based prism spectrometer. It is identical to a grating instrument except that the dispersion element used is pellin broca prism. The prism has constant efficiency over its range of transmittance. Filter is not required for measurement. In many cases, it is the ideal choice for absorption and emission spectra measurement and characterization.
CD214 Series spectrometers are available from Holmarc in various resolution and wavelength range for multitudes of spectroscopic applications. Various accessories include directly attachable light sources and sample holders. Sample holder for 10mm cuvettes connects to the entrance slit of the spectrometer. The optional dual entrance and exit ports allow the user to set up two or more experiments simultaneously. The spectrometer is flexible in design so that it can be easily customized to suit specific applications.
The Spectra Prism Spectrometer is a low-cost, lab spectrometer that is ideal for general purpose laboratory and research spectroscopic applications. The use of linear CCD array with P.B prism makes it more convenient and user friendly compared to other spectroscopes. It is more reliable and cost effective compared to grating spectrometers.
Our CD214 Series Prism Spectrometer’s wavelength range is from 400nm to 700nm and utilizes a detector with 3648 active pixels; that is 3648 data points in one full spectrum. The spectrometer is configured with a micrometer controlled entrance slit which opens from 0-3 mm in width by micrometer adjustment. Optical resolution is approximately 0.15 nm.
| Model No: | Dispersion Element | Wavelength Range | Detector | Resolution | Price ($) |
| Spectra CD 214VIS | PB N-SF1 | 400 - 700 nm | Line CCD 3648 pixels | 0.15 nm | 2,534.00 |
| Spectra CD 214NIR | PB N-SF1 | 650 - 950 nm | Line CCD 3648 pixels | 0.26 nm | 2,467.00 |
For the spectra prism spectrometers, directly attachable light source and sample holders are available as accessories (sold separately). The most common light source is quartz halogen lamp. Sample holder we stock generally is for 10mm cuvetts which connects to the front side of the spectrometer. Software has capabilities for capturing single or continuous spectra, custom wavelength calibration, dark subtraction and intensity comparison, simultaneous display of overlay multiple spectra, exporting dat to microsoft® excel etc. The software has facilities for spectrum saving in programmed intervals.


Established in 1993, Holmarc Opto-Mechatronics Ltd manufactures variety of scientific and engineering instruments for research, industry and education.
ISO 9001:2015 Made in INDIA
CIN : L33125KL1993PLC006984
GST No : 32AAACH9492C1ZQ
Navigation
Get in Touch
B.7., H.M.T. Industrial Estate
H.M.T. P.O, Kalamassery, Kochi
Kerala, India - 683 503
+91 920-719-7772 / 6 / 1
sales@holmarc.com
Mon - Sat : 9 am to 5 pm
Investor Zone # Online Dispute Resolution